Background

CHP for Hospitals Hypothetical Project Locations
Hospitals and healthcare systems are at the front line of responding to natural disasters, reducing mortality rates, and assisting with public health crises. Combined heat and power (CHP) systems can ensure that these facilities, along with the patient health and critical life support systems they house, operate nonstop, even during grid outages.”
(Source: US DOE CHP Fact sheets)
In this case study we examine the feasibility of a 20-year Renewable Natural Gas (RNG) fueled CHP Microgrid (CHP + Solar), for a typical 241,351 sq.ft, 5 Floors Hospital (as described by the US DOE Reference Buildings) in 4 different states across the US; California, Texas, Pennsylvania, and Minnesota.
These states were selected based on maximum feasibility potential for CHP systems according to the CHP project profile installation database and state regulations, energy prices, emissions and other factors (checkout our article on this subject).
The proposed solution will also include a new Absorption chiller to maximize the CHP feasibility potential and extend full load operation during the summer season.
With the Inflation Reduction Act recently signed into law by President Biden; projects involving these technologies will receive 30% Tax Credit Incentives if placed in operation before the end of 2024.
What Makes CHP Microgrids hyper feasible for Hospitals
Hospitals require continuous power for their operations and have significant thermal demands for heating, hot water, steam for sterilization, cooling, dehumidification, and laundry services. These coincident thermal and electric loads make CHP a good fit to provide year-round critical power and thermal energy.”
(Source: US DOE CHP Fact sheets)
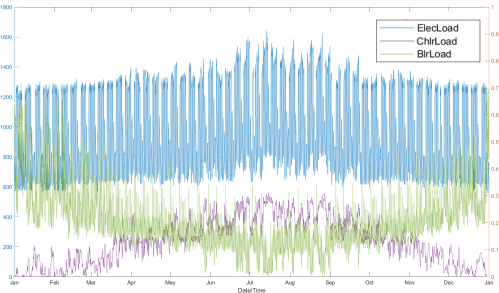
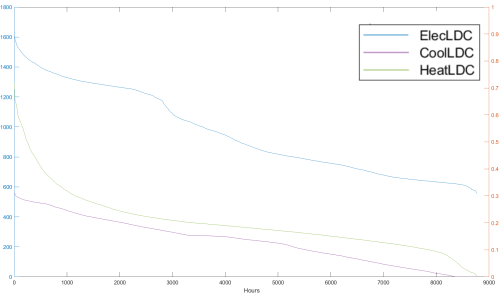
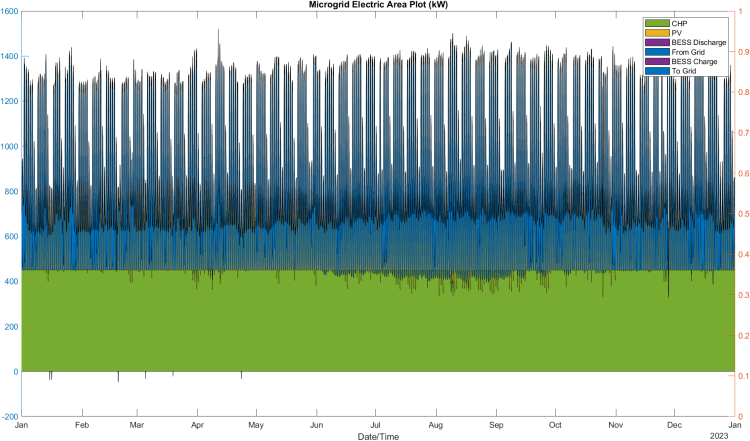
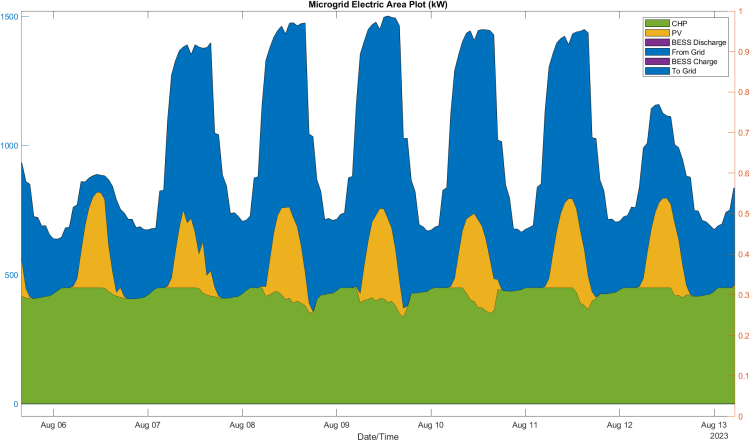
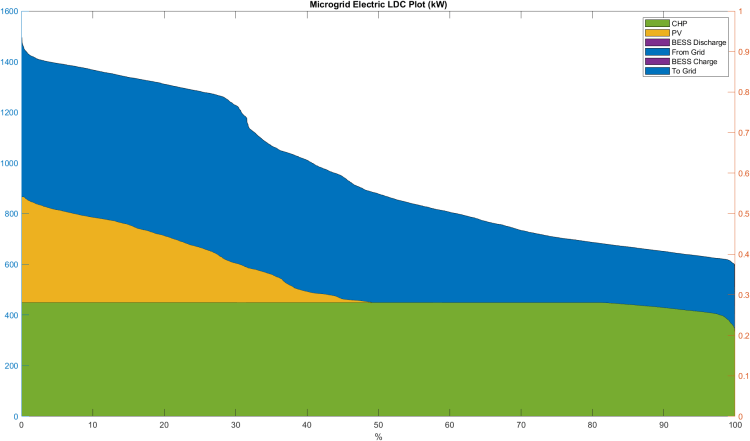
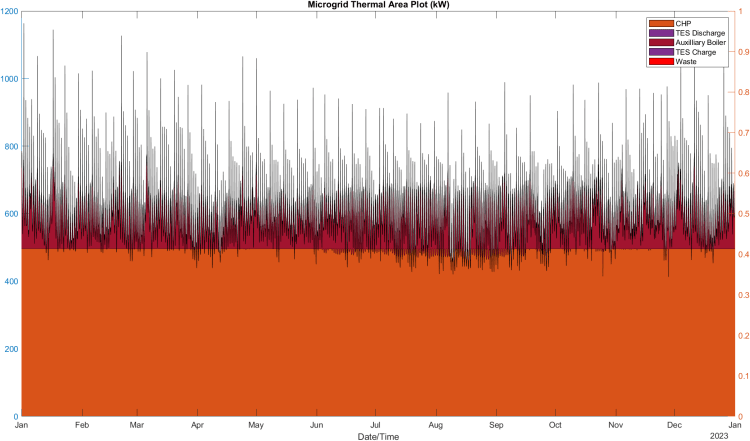
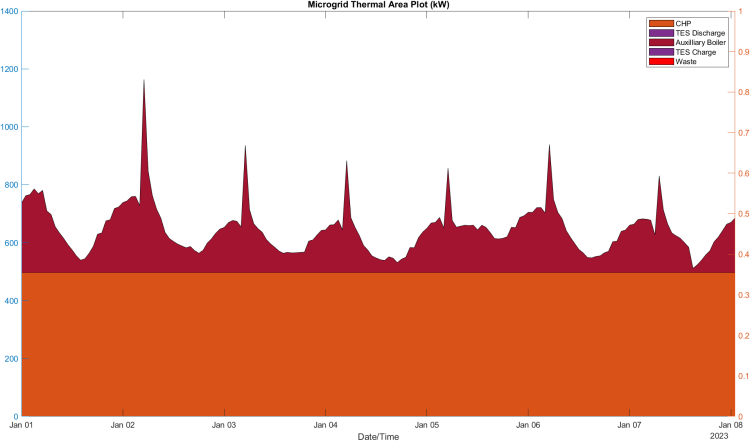
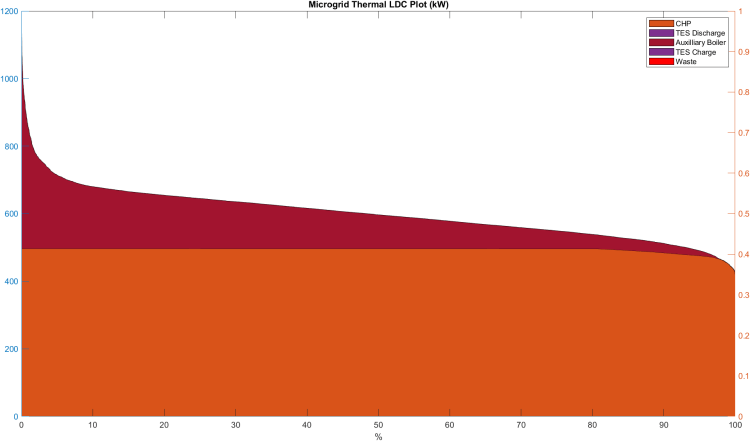
With that said, this feasibility study only examines the Thermal Demand from Space Heating and Cooling as depicted in the Typical Profiles and Duration Curves on the right. This means that the potential for CHP feasibility could be even higher than the results from this study.
Why examine RNG and not Natural Gas as fuel for the CHP Microgrid
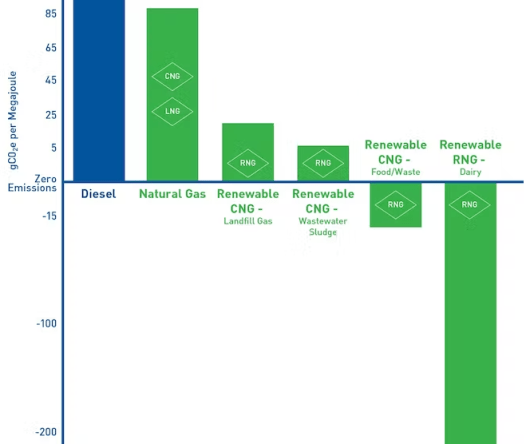
RNG projects capture and recover methane produced at a landfill or anaerobic digestion (AD) facility. Methane has a global warming potential more than 25 times greater than CO2 and a relatively short (12-year) atmospheric life, so reducing these emissions can achieve near-term beneficial impacts in mitigating global climate change.”
(Source: EPA.gov)
RNG can be purchased in the form of:
- Carbon Reduction Credits or Certificates for scope 1 emissions (i.e. onsite direct emitting stationary energy generation equipment) separate from actual natural gas purchases (unbundled). Examples of organizations providing RNG certificates are:
- Utility bundled Natural Gas and RNG Tariffs such as:
- SoCalGas in California.
- VGS in Vermont.
- A number of Pennsylvania Gas utilities.
Investing in RNG Certificates and tariffs supports the development of more RNG projects, and in turn decarbonizes the gas pipeline infrastructure, increases and diversifies domestic energy production, and benefits the local economy.
Existing and CHP Microgrid System Assumptions
To begin assessing the feasibility of the CHP – PV system, we would need to make a series of simplified assumptions related to the building space, shape, equipment, utility providers, outages, and the Hospital owner’s financial considerations.
These assumptions are generalized for all locations, under the categorization listed in the Appendix section of this study, to help ease the feasibility process. However, only a few location-related critical assumptions are made, at the end of the assumptions, that can have a significant impact on the project feasibility.
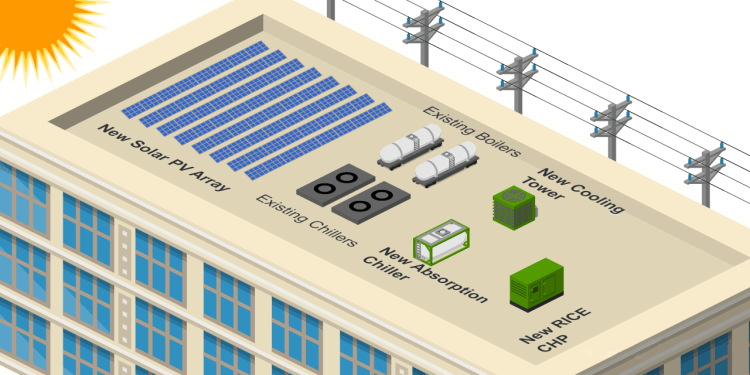
Hospital Assumed Roof Equipment
CogenS™ Modeling Results
There are far too many factors to consider when properly evaluating CHP systems feasibility; Cooling, Heating and Power systems efficiency, part-load performance, multi-unit operation, ambient temperature performance effects, optimization, dispatch control, degradation, complex utility tariffs for with and without the CHP Microgrid, financial modeling … just to name a few.
CogenS™ modeling process is highly sophisticated and detailed in that sense, making it a perfect techno-economic modeling tool for CHP projects requiring such complex capabilities for investment grade feasibility studies.
In this case study, we used CogenS™ to run an investment grade model for the Hospital system described above for each of the target states aforementioned; California, Texas, Pennsylvania, and Minnesota.
The resulting environmental and economic benefits of the model proved more than feasible when it comes to any organization measure of success:
- A staggering 23% Internal Rate of Return.
- A remarkable 4 years discounted payback period.
- An outstanding 48% CO2e emission reduction (equivalent to 1698 Tonnes/year).

Note: These numbers are the average results of all 4 states studied.
Conclusion
Hospitals around the US should be seriously considering CHP systems for their scope 1 emissions reduction, power resiliency enhancement, and energy efficiency improvement plans for the next 20 years:
- CO2e emissions can be reduced by up to 50%, 2219 Tonnes/year, by investing in RNG certificates or tariffs from the local providers.
- Energy bill savings can reach upwards of 35%, or $450,000 annually.
- The project can pay for itself in as little as 3 years.

“Acting now, by investing in a CHP Microgrid feasibility study, is crucial in order to take advantage of the Inflation Reduction Act before the end of 2024.”
APPENDIX
CASE STUDY ASSUMPTIONS
Space Assumptions:
- The roof space was calculated as the total Hospital area of 241,351 sq.ft, divided by 5 floors, equating to 48,270 sq.ft. of roof space.
- Only half of the roof area is available for a roof mounted Solar PV array, equating to 24,135 sq.ft.
- Space is available for CHP system installation, and Hot/Chilled water piping modifications.
Microgrid sizing Assumptions:
- A 21 Watt/sq.ft. Solar PV Array production rate, which equates to approximately 500 kW DC of roof-mounted Solar PV with 12% losses.
- The CHP system is sized for baseload operation at 450 kW.
- The absorption chiller is sized at 100 tons to serve 50% of the cooling load, with the electric chillers, throughout the year.
Grid Assumptions:
- Grid outages occur according to the below schedule:
- 25-Oct at 08:00 AM for 2 hours
- 27-Nov at 14:00 PM for 10 hours
- A Critical Electric Load factor of 0.5 during outages.
- A 51 $/Tonne cost of Carbon Dioxide equivalent emissions (CO2e).
- A 150 $/Tonne cost of reduction in CO2e using Renewable Natural Gas (RNG).
Equipment Efficiency Assumptions:
- Existing Electric Chiller system for space cooling rated at 12 EER efficiency.
- Existing Hot Water Gas Boilers for space heating rated at 80% efficiency.
- New Reciprocating Engine CHP unit rated at 40.6% Electric Efficiency, and 45.2% Thermal Efficiency.
- New Water-Cooled Single-Stage Absorption Chiller rated at 0.7 COP.
- 96% PV-Inverter efficiency.
Fuel and Emissions Assumptions:
- A 117 lb/MMBtu CO2e Factor for Natural Gas (NG) fueled Boilers.
- A 20 lb/MMBtu CO2e Factor for RNG fueled CHP.
- A zero CO2e Factor for Solar Production.
Financial Assumptions:
- Study period: 20 years.
- Capital and Operating expenses:
CHP | PV | Absorption Chiller | |
Installed Capital Cost | 1700 $/kWe | 1720 $/kWDC | 6,000 $/ton |
O&M Cost | 0.017 $/kWh | 18.55 $/kWDC/year | 0.006 $/ton-hr |
- Loan:
Amount | Interest Rate | Term |
$1,000,000 | 6% | 20 years |
- Depreciation and Incentives:
CHP | PV | Absorption Chiller | |
Depreciation | 5 years – MACRS | 5 years – MACRS | 5 years – MACRS |
Tax Credit Incentive | 30% of installed cost | 30% of installed cost | 30% of installed cost |
- Effective Tax Rate: 22%
- Nominal Discounting Rate: 6%.
- Inflation Rates:
Electric charges | NG charges | O&M charges | |
Annual Inflation rate | 1.5% | 1.5% | 2% |
Location specific assumptions:
CA | TX | PA | MN | |
Grid Emissions | ||||
eGrid 2020 CO2e Factor (lb/MWh) | 515.5 | 822.04 | 655.4 | 986.63 |
Energy charges | ||||
TOU Energy and Demand Electric Charges | yes | yes | no | no |
Seasonal Energy and Demand NG Charges | yes | no | no | yes |
Average Electric Energy Charge ($/kWh) | 0.11735 | 0.0892 | 0.0686 | 0.11 |
Average Electric Demand Charge ($/kW) | 21.03 | 11.0971 | 10.575 | 4.75 |
Average NG Energy Charge ($/Therm US) | 1.436 | 0.6032 | 0.86 | 0.5892 |
Average NG Demand Charge ($/Daily Max Therm US) | 0 | 0 | 0 | 1.5272 |
Electric Load | ||||
Peak Demand (kW) | 1,519 | 1,704 | 1,672 | 1,643 |
Annual Energy (MWh) | 8,498 | 9,011 | 8,567 | 8,425 |
Heating Load | ||||
Peak Demand (MMBTU/h) | 3.186 | 3.193 | 4.353 | 4.410 |
Annual Energy (MMBTU) | 8,779 | 7,719 | 10,270 | 10,861 |
Cooling Load | ||||
Peak Demand (Ton) | 200 | 227.5 | 150 | 160 |
Annual Energy (MWh) | 4,258 | 4,361 | 2,142 | 2,106 |
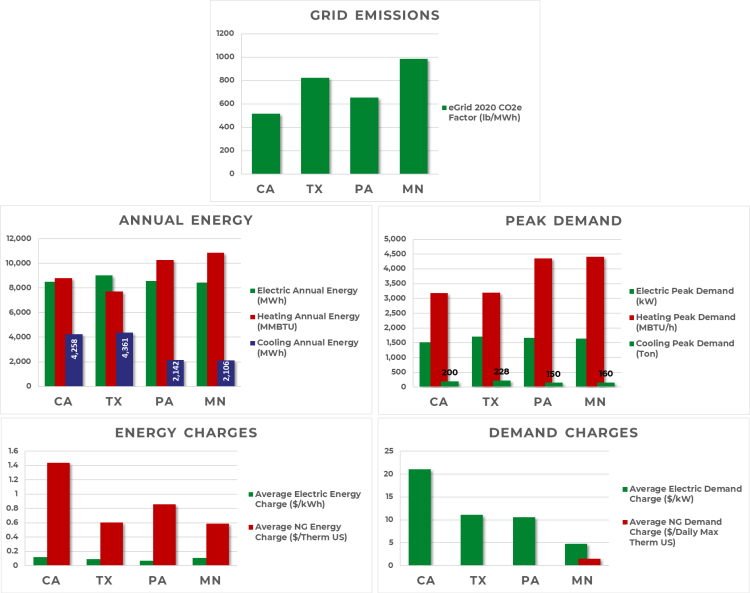
Location Energy and Emissions Assumptions at a Glance
BASE CASE MODELING RESULTS USING COGENS
CA | TX | PA | MN | |
Annual Energy Consumption | ||||
Electric Peak Demand (kW) | 1,519 | 1,704 | 1,672 | 1,643 |
Electric Annual Energy (MWh/year) | 8,498 | 9,011 | 8,567 | 8,425 |
Heating Peak Demand (MBTU/h) | 3,186 | 3,193 | 4,353 | 4,410 |
Heating Annual Energy (MMBTU/year) | 8,779 | 7,719 | 10,270 | 10,861 |
Boiler system consumption (Therms US/year) | 109,480 | 96,509 | 13,070 | 138,250 |
Chiller system consumption (MWh/year) | 602 | 862 | 517 | 497 |
Annual CO2e Emissions | ||||
Base Case Heating CO2e (Tonne/year) | 581 | 512 | 694 | 734 |
Base Case Grid CO2e (Tonne/year) | 1,984 | 3,354 | 2,543 | 3,764 |
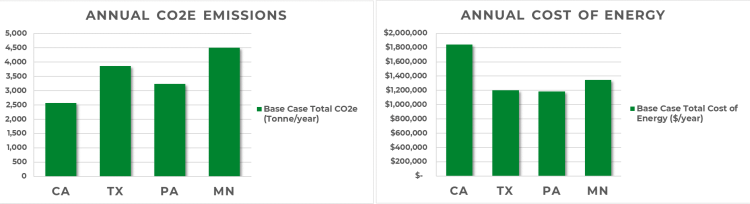
Base Case Total CO2e (Tonne/year) | 2,567 | 3,869 | 3,239 | 4,500 |
Annual Energy Cost | ||||
Base Case Cost of CO2e ($/year) | $ 130,921 | $ 197,304 | $ 165,185 | $ 229,533 |
Base Case Cost of Electricity ($/year) | $ 1,553,600 | $ 943,455 | $ 866,639 | $ 1,008,000 |
Base Case Cost of Gas ($/year) | $ 156,148 | $ 58,653 | $ 152,951 | $ 105,809 |
Base Case Cost of Outages ($/year) | $ 2,224 | $ 2,398 | $ 2,223 | $ 2,177 |
Base Case Total Cost of Energy ($/year) | $ 1,842,800 | $ 1,201,800 | $ 1,187,000 | $ 1,345,500 |
Base Case Results at a glance
CHP MICROGRID SYSTEMS MODELING RESULTS USING COGENSTM
CA | TX | PA | MN | |
Annual Peak Demand | ||||
New Electric Peak Demand (kW) | 1,520 | 1,636 | 1,606 | 1,610 |
New Grid supplied Peak Demand (kW) | 1,057 | 1,116 | 1,233 | 1,245 |
New Heating Peak Demand (MBTU/h) | 3,970 | 3,955 | 4,353 | 4,410 |
Annual Energy Consumption | ||||
New Total Electric Energy (MWh/year) | 8,470 | 8,804 | 8,396 | 8,456 |
New Heating Annual Energy (MMBTU/year) | 17,946 | 17,692 | 15,307 | 15,731 |
Boiler system Consumption (Therms US/year) | 40,861 | 43,913 | 15,131 | 22,034 |
Existing Chiller system consumption (MWh/year) | 474 | 549 | 258 | 249 |
New Cooling Tower Consumption (MWh/year) | 102 | 109 | 92 | 285 |
CHP consumption (Therms US/year) | 326,830 | 317,860 | 329,700 | 332,200 |
CHP Electric Production (MWh/year) | 3,897 | 3,717 | 3,584 | 3,587 |
CHP Heat Production (MMBTU/year) | 14,739 | 14,383 | 14,028 | 14,025 |
CHP Waste Heat (MMBTU/year) | 0 | 0 | 0 | 0 |
Solar PV Electricity Production (MWh/year) | 882 | 821 | 645 | 704 |
Excess Electricity sent to Grid (MWh/year) | -0.50 | -0.07 | -0.20 | -0.62 |
Consumed Electricity from Grid (MWh/year) | 3,688 | 4,262 | 4,164 | 4,163 |
Gas consumed from Grid (Therms US/year) | 367,690 | 361,780 | 344,830 | 354,240 |
Annual CO2e Emissions | ||||
CHP Microgrid Heating CO2e (Tonne/year) | 217 | 233 | 80 | 119 |
CHP Microgrid Grid CO2e (Tonne/year) | 862 | 1,589 | 1,238 | 1,862 |
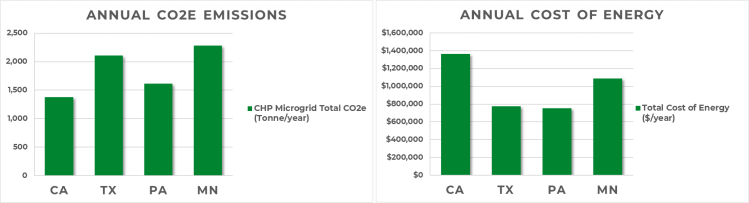
CHP Microgrid Total CO2e (Tonne/year) | 1,376 | 2,111 | 1,617 | 2,281 |
CHP Microgrid RNG CO2e reduced (Tonne/year) | 1,434 | 1,398 | 1,450 | 1,400 |
Annual Energy Cost | ||||
Cost of CO2e ($/year) | $ 70,152 | $ 107,644 | $ 82,484 | $ 116,000 |
Cost of Electricity ($/year) | $ 819,821 | $ 462,560 | $ 373,370 | $ 520,000 |
Cost of Gas ($/year) | $ 475,101 | $ 207,048 | $ 296,512 | $ 243,000 |
Cost of RNG Credit ($/year) | $ 215,100 | $ 209,700 | $ 217,500 | $ 210,000 |
Total Cost of Energy ($/year) | $ 1,365,100 | $ 777,252 | $ 752,366 | $ 1,089,000 |
CHP Microgrid Results at a glance
RNG CHP & Solar Microgrid for Hospital Technoeconomic Key Project Performance Indicators
RNG CHP MICROGRID FOR HOSPITAL PROJECT KPIS | |||||
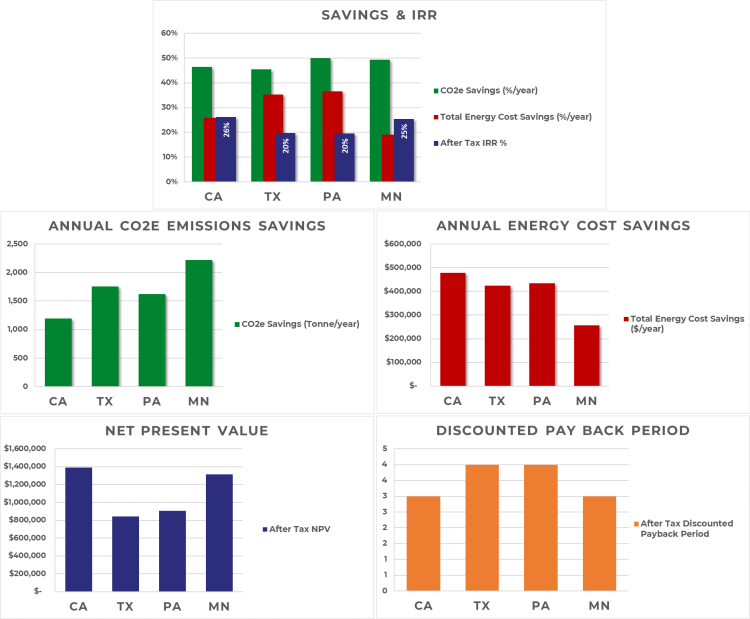
CO2e Savings (Tonne/year) | 1,192 | 1,758 | 1,622 | 2,219 | |
CO2e Savings (%/year) | 46% | 45% | 50% | 49% | |
Total Energy Cost Savings ($ /year) | $ 477,700 | $ 424,548 | $ 434,634 | $ 256,500 | |
Total Energy Cost Savings (%/year) | 26% | 35% | 37% | 19% | |
Before Tax NPV | $ 911,270 | $ 210,210 | $ 357,290 | $ 792,970 | |
Before Tax IRR % | 11% | 6% | 7% | 10% | |
Before Tax Simple Payback Period | 9 | 13 | 12 | 9 | |
Before Tax Discounted Payback Period | 11 | 17 | 15 | 12 | |
Before Tax Benefit to Cost Ratio | 1.1 | 1.0 | 1.0 | 1.1 | |
Before Tax Equivalent Annual Revenue | $ 66,588 | $ 15,360 | $ 26,108 | $ 57,943 | |
After Tax NPV | $ 1,390,500 | $ 843,730 | $ 907,250 | $ 1,315,300 | |
After Tax IRR % | 26% | 20% | 20% | 25% | |
After Tax Simple Payback Period | 3 | 3 | 4 | 3 | |
After Tax Discounted Payback Period | 3 | 4 | 4 | 3 | |
After Tax Benefit to Cost Ratio | 1.2 | 1.1 | 1.1 | 1.2 | |
After Tax Equivalent Annual Revenue | $ 101,610 | $ 61,652 | $ 66,294 | $ 96,114 | |
CHP Microgrid for Hospital Project Tecno-economic KPIs
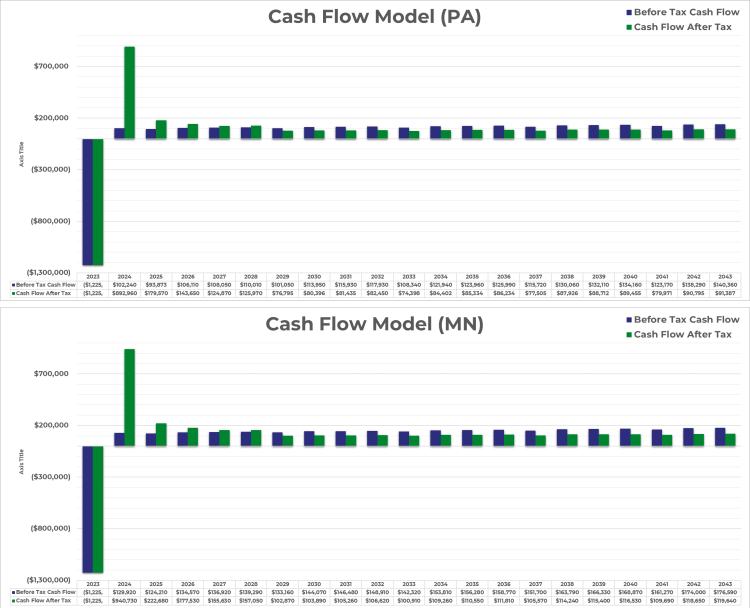
RNG CHP & Solar Microgrid for Hospital Cash Flows Before and After Tax
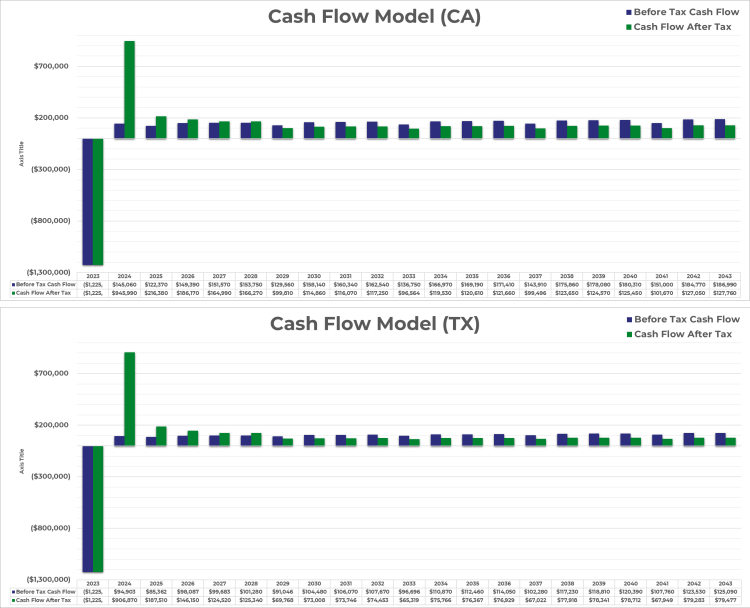
CogenS RNG CHP & Solar Microgrid Energy Plot Samples for California Hospital