Introduction to the Technoeconomic Analysis of Green Hydrogen
The transition toward a decarbonized global economy hinges on the deployment of zero-emission energy carriers. Green hydrogen, produced via the electrolysis of water utilizing renewable electricity, stands at the forefront of this paradigm shift. However, commercializing novel thermodynamic processes requires more than just technical feasibility; it demands rigorous financial justification. Technoeconomic Analysis (TEA) serves as the critical bridge separating conceptual electrochemistry from bankable infrastructure projects. By integrating high-fidelity process simulations with dynamic financial modeling, TEA provides a quantifiable framework to evaluate capital investments, operational expenses, and thermodynamic efficiencies. As energy developers scale electrolyzer arrays from megawatts to gigawatts, the margin for error shrinks. Consequently, understanding the intricate codependence between engineering performance—such as stack degradation and conversion efficiency—and economic outcomes is essential for structuring resilient, profitable green hydrogen ventures.
Defining Technoeconomic Analysis (TEA) in the Modern Energy Sector
Yields, Efficiency
CAPEX, OPEX, WACC
Technoeconomic Analysis (TEA) in the modern energy sector is a comprehensive, multidisciplinary methodology used to evaluate the economic performance of a technological process. At its core, TEA mathematically couples mass and energy balances derived from chemical engineering principles with corporate finance metrics. Unlike standard financial appraisals, which often rely on static or historical operational assumptions, TEA dynamically calculates costs based on primary thermodynamic and kinetic data. In green hydrogen production, TEA encompasses everything from the AC/DC rectification losses of renewable power inputs to the final compression energy required for storage. Analysts construct models that iterate through operational parameters—such as fluctuating capacity factors from intermittent renewables—to forecast a project's cash flows over its technical lifetime. Ultimately, TEA establishes whether a proposed engineering configuration can meet the target cost constraints required to compete in broader energy markets.
The Role of Green Hydrogen in Global Decarbonization and Market Trajectories
Hard-to-Abate Sectors
Green hydrogen is widely recognized as the linchpin for decarbonizing "hard-to-abate" sectors, including heavy-duty transportation, steel manufacturing, and maritime shipping. Unlike direct electrification, which struggles with the energy density requirements of these industries, hydrogen provides a high-gravimetric-energy chemical alternative. The global trajectory for clean hydrogen demand is steep. According to the International Energy Agency, achieving net-zero emissions by 2050 requires a dramatic scale-up in low-carbon hydrogen production, targeting hundreds of millions of tons annually (Source: iea.org). Market trajectories indicate a rapid pivot from fossil-derived "grey" hydrogen to electrolytic green hydrogen, driven by simultaneous declines in renewable electricity costs and electrolyzer capital expenses. However, realizing this potential necessitates massive capital deployment, requiring robust technoeconomic models to guide investors through market uncertainties and long-term commodity price forecasting.
Core Methodologies in Technoeconomic Modeling
Definition
Simulation
Estimation
Analysis
Executing a high-quality technoeconomic model involves a standardized, iterative methodology. The first phase requires scoping: establishing the objective, capacity, and spatial boundaries of the analysis. The second phase, process simulation, involves building a steady-state or dynamic model using specialized chemical engineering software (e.g., Aspen Plus, HYSYS) to solve complex mass and energy balance equations. These outputs yield the required sizing for equipment and the exact utility consumption rates per unit of product. The third phase is cost estimation, where analysts apply scaling exponents and capital cost indices to price out the equipment (CAPEX) and calculate continuous feed expenses (OPEX). Finally, the methodology concludes with cash flow analysis, applying discount rates and inflation indices over the project's operational lifetime to generate key financial metrics. This sequential rigor ensures economic outputs are strictly tethered to physical realities.
Establishing the System Boundary and Plant Capacity
→ Raw Water
O2 Vent →
Defining the system boundary is arguably the most critical preliminary step in TEA, as it dictates exactly which capital components and operational streams are included in the cost analysis. For a green hydrogen facility, a "gate-to-gate" boundary typically includes the step-down transformers, water purification systems, the electrolyzer stacks, and immediate gas conditioning equipment. If the boundary expands to "cradle-to-gate," it must account for upstream renewable energy generation assets (wind turbines or solar arrays) and their respective levelized costs of electricity. Simultaneously, establishing the nameplate plant capacity (e.g., a 100 MW or 500 MW electrical input) fundamentally impacts the economies of scale. Capacity determines the sizing of the balance of plant and heavily influences the capacity factor—the ratio of actual hydrogen output to theoretical maximum output—which is a primary lever in profitability.
Process Simulation, Thermodynamics, and Mass-Energy Balances
Process simulation translates the foundational electrochemistry of water splitting into actionable engineering data. At standard conditions, the thermodynamics of water electrolysis dictate a minimum reversible voltage (1.23 V) and an enthalpy change of 286 kJ/mol. However, practical mass-energy balances must account for overpotentials, ohmic resistance, and thermal losses, meaning real-world electrolyzers require voltages closer to 1.8-2.0 V. By utilizing chemical process simulators, analysts map the complete thermodynamic envelope of the plant. This includes tracking the exothermic heat generated by the stacks, which requires auxiliary cooling water systems, and calculating the precise Faraday efficiency (the ratio of actual hydrogen produced to theoretical yields based on electrical current). Accurate mass-energy balances ensure that power consumption estimates are realistic, forming a credible foundation for the subsequent OPEX calculation phase.
Capital Expenditure (CAPEX) Estimation and Cost Scaling
Capital Expenditure (CAPEX) estimation transforms equipment sizes derived from process simulations into total installed costs. In hydrogen TEA, direct CAPEX includes the procurement of the electrolyzer stacks, power electronics, gas separators, and cooling systems. Because precise vendor quotes are rarely available for conceptual designs, engineers employ cost scaling methodologies. The most prevalent is the "six-tenths rule," a power-law relationship suggesting that as plant capacity doubles, the capital cost increases by only a factor of approximately 1.5. This non-linear scaling indicates significant economies of scale at the gigawatt level. Beyond direct equipment costs, total CAPEX must incorporate site preparation, piping, instrumentation, and installation labor. Analysts adjust historical cost data using current indices (such as the Chemical Engineering Plant Cost Index) to account for macroeconomic inflation and supply chain shifts.
Electrolyzer Technologies: ALK, PEM, and SOEC Cost Comparisons
Lowest CAPEX
Mature Tech
Medium CAPEX
Highly Flexible
Highest CAPEX
Max Efficiency
Selecting the electrolyzer technology is the primary driver of equipment costs and performance profiles. Alkaline (ALK) electrolyzers represent the most mature and cost-effective technology, utilizing non-precious metal catalysts (e.g., nickel), keeping direct CAPEX low. However, their slower transient response limits flexibility with intermittent renewables. Proton Exchange Membrane (PEM) electrolyzers are increasingly favored for wind and solar integration due to their rapid ramp rates and compact footprint, though reliance on iridium and platinum drives up their specific capital cost. Solid Oxide Electrolyzer Cells (SOEC) operate at high temperatures (700–850°C), drastically reducing electricity demand by utilizing waste heat. While SOEC presents the highest baseline electrical efficiency, it currently suffers from the highest CAPEX and fastest stack degradation rates. Current baseline cost parameters for these technologies are continually updated by national laboratories to reflect aggressive global R&D (Source: nrel.gov).
Balance of Plant (BoP), Compression, and Storage Infrastructure Costs
(40-50%)
While the electrolyzer stack is the heart of the facility, the Balance of Plant (BoP) routinely accounts for 50% or more of the direct capital costs. BoP encompasses the supporting infrastructure required to keep the electrochemistry stable. Heavy-duty power electronics, primarily rectifiers that convert grid AC to stack DC, are highly capital-intensive. Additionally, the system requires sophisticated deionized water treatment skids, as raw municipal or groundwater contains impurities that quickly poison catalysts. Beyond the generation step, hydrogen’s low volumetric energy density necessitates expensive post-processing. Mechanical compression to 350 or 700 bar demands multi-stage, intercooled compressors with significant parasitic electrical loads. If the facility is designed to buffer supply for off-takers, high-pressure storage vessels (e.g., Type IV carbon-composite tanks or underground salt caverns) introduce substantial additive CAPEX that must be accurately parameterized in the TEA.
Grid Interconnection and Indirect Capital Costs
Equipment, Labor
EPC, Permitting, Grid
Direct equipment costs represent only a fraction of the Total Capital Investment (TCI). Indirect capital costs encompass the hidden financial burdens of bringing a mega-project online. For large-scale green hydrogen facilities, grid interconnection is a major financial hurdle. Dedicated high-voltage substations, step-down transformers, and miles of transmission lines represent substantial, often underestimated line items. Furthermore, systemic indirect expenses—such as Engineering, Procurement, and Construction (EPC) contractor fees, which typically range from 10% to 20% of direct costs—must be factored in. Permitting, legal fees, land acquisition, and project contingencies form the "soft costs." Depending on the technological maturity and site location, TEA modelers apply a contingency buffer of 15% to 30% to shield the financial projections from unforeseen construction delays and material price fluctuations, thereby yielding a robust baseline for required financing.
Operational Expenditure (OPEX) and Feedstock Economics
Operational Expenditure (OPEX) dictates the day-to-day profitability of a green hydrogen plant. OPEX is categorized into fixed and variable costs. Fixed OPEX includes property taxes, insurance, overhead labor, and routine facility maintenance, usually calculated as a flat percentage (e.g., 2-4%) of the total installed CAPEX. Variable OPEX, however, is heavily dominated by feedstock economics. In a green hydrogen facility, the feedstock is zero-carbon electricity. Power consumption routinely comprises 60% to 80% of the total levelized cost of the final hydrogen product. Because electrolysis requires roughly 50 to 55 kWh of electricity to produce a single kilogram of hydrogen, even marginal fluctuations in wholesale power prices drastically alter profitability. Consequently, precise modeling of power market dynamics and energy consumption rates is the most sensitive analytical lever in hydrogen technoeconomics.
Renewable Electricity Sourcing and Power Purchase Agreements (PPAs)
To secure the low and predictable electricity prices necessary for economic viability, project developers rarely rely on spot market power purchasing. Instead, they structure long-term Power Purchase Agreements (PPAs) directly with wind and solar asset owners. A PPA guarantees a fixed price for electricity (e.g., $30/MWh) over a 10-to-20-year horizon, neutralizing the extreme volatility of wholesale energy markets. However, the intermittency of renewable sourcing introduces operational complexities. If a plant relies strictly on a solar PPA, its electrolyzers may only operate 25% of the year (a low capacity factor), stranding capital and driving up the levelized cost. Technoeconomic models must simulate hybrid renewable strategies—combining wind, solar, and potentially battery storage—to optimize the capacity factor against the added costs of "firming" the renewable power supply under strict green certification constraints.
Water Consumption, Treatment, and Supply Costs
While electricity dominates operational expenses, water is the fundamental chemical feedstock. Stoichiometrically, producing 1 kilogram of hydrogen requires precisely 9 liters of water. In reality, accounting for evaporation in cooling towers and the rejection rates of purification systems, a facility consumes between 11 and 18 liters of raw water per kilogram of hydrogen. Electrolyzer cells are highly sensitive to cations and minerals; therefore, raw water must pass through reverse osmosis and electrodeionization units to achieve ultrapure, ASTM Type II standards. Although the raw cost of municipal water is relatively low (often pennies per cubic meter), the capital cost of the purification skid and the energy penalty of desalination (in coastal arid regions) must be captured in the TEA. Additionally, localized water scarcity presents a mounting environmental and permitting risk for developers.
Predictive Maintenance and Electrolyzer Stack Replacement Cycles
Electrolyzers are subject to relentless electrochemical degradation. Over time, catalyst poisoning, membrane thinning, and electrode passivation increase internal electrical resistance. This degradation manifests as an increase in the cell voltage required to maintain hydrogen output (typically measured in microvolts per hour, µV/h), subtly increasing specific power consumption over time. Eventually, the efficiency drop warrants a total stack replacement. In TEA, stack lifespans are modeled between 60,000 and 80,000 operational hours (roughly 7 to 10 years at high capacity factors). This overhaul constitutes a major periodic capital expense, often equal to 15-20% of the initial plant CAPEX. Advanced financial models incorporate predictive maintenance algorithms and gradual performance decay curves, rather than assuming flat efficiency, ensuring the required cash reserves for stack replacement are accurately amortized over the facility's life.
Calculating the Levelized Cost of Hydrogen (LCOH)
The Levelized Cost of Hydrogen (LCOH) is the gold-standard metric for benchmarking project feasibility. Represented in dollars per kilogram ($/kg), LCOH acts as the break-even price at which hydrogen must be sold to exactly cover all capital, operational, and financial costs, providing the investors their minimum required rate of return. The calculation is executed by taking the net present value of all lifetime system costs (both CAPEX and OPEX) and dividing it by the net present value of all the hydrogen mass produced over the project's lifetime. By levelizing the costs, TEA enables apples-to-apples comparisons across wildly different technologies, capacities, and geographies. It distills complex, multi-decade cash flows into a singular, digestible benchmark, allowing developers to immediately compare green hydrogen’s competitiveness against conventional fossil-derived grey hydrogen, which currently sits near $1.50/kg.
Financial Assumptions: Discount Rates, WACC, and Project Lifetime
The structural integrity of an LCOH calculation heavily depends on its underlying financial assumptions. The Time Value of Money dictates that a dollar spent today costs more than a dollar spent tomorrow. To account for this, future cash flows and hydrogen yields are discounted to their present value. The discount rate applied is typically the Weighted Average Cost of Capital (WACC), which blends the cost of debt (bank loans) and the cost of equity (investor capital). For nascent green hydrogen projects, high technological risk often pushes the WACC between 8% and 12%, significantly increasing the LCOH compared to mature solar projects. Additionally, the project lifetime assumption—standardized at 20 to 25 years—determines the period over which massive initial capital outlays can be amortized. Extended lifetimes reduce LCOH but carry higher risks of terminal equipment failure.
Standardized LCOH Formulas and Financial Metrics (NPV, IRR)
While LCOH acts as the central comparative metric, commercial viability is ultimately judged by standard corporate finance parameters: Net Present Value (NPV) and the Internal Rate of Return (IRR). In a discounted cash flow model, projected revenues from hydrogen sales (contracted at a specific market price) are plotted against expenditures. The NPV aggregates these discounted cash flows; an NPV greater than zero indicates the project will generate wealth above its financing costs. The IRR represents the specific discount rate that brings the NPV exactly to zero. Essentially, IRR is the annualized effective compounded return rate. Investors require the IRR to comfortably clear a "hurdle rate" (often 12-15% for early-stage hydrogen infrastructure) to compensate for off-taker credit risks and technology scale-up uncertainties, ensuring the venture is highly bankable.
Sensitivity Analysis and Market Risk Assessment
Because technoeconomic models project operations decades into the future, they are inherently fraught with input uncertainty. Sensitivity analysis is deployed to systematically test the resilience of the project's economics against variable market conditions. Analysts isolate key parameters—such as electricity price, total CAPEX, and electrolyzer conversion efficiency—and adjust them by a fixed percentage (e.g., ± 20%) while holding all other variables constant. This isolates exactly how much the LCOH or IRR will shift if, for instance, raw material supply chains cause an unexpected spike in stack costs. A comprehensive market risk assessment utilizes these sensitivity outputs to construct bounds of probability, ensuring developers are not making multi-million dollar capital commitments based entirely on optimistic, best-case-scenario baseline assumptions.
Monte Carlo Simulations for Energy Price Volatility
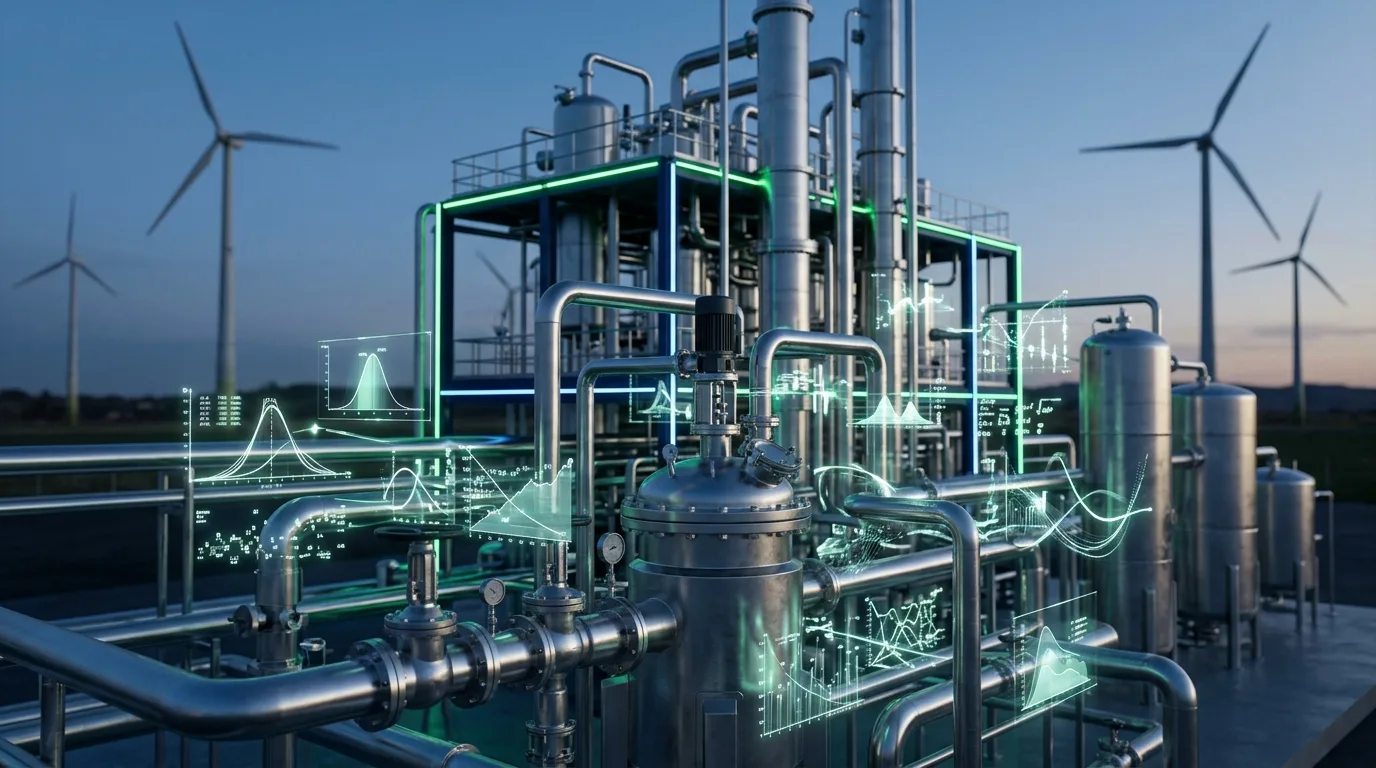
Single-point sensitivity analysis is useful but limited; it cannot capture the simultaneous, compounding risks inherent in volatile energy grids. To perform a true stochastic analysis, TEA incorporates Monte Carlo simulations. Instead of using a static electricity price, analysts assign a probability distribution (e.g., a normal or log-normal curve) to wholesale power costs, capacity factors, and CAPEX. The simulation software then rapidly recalculates the financial model tens of thousands of times, randomly sampling from these distributions. The result is a bell curve demonstrating the probability of achieving a specific LCOH. This probabilistic approach is incredibly valuable for evaluating grid-tied green hydrogen systems exposed to spot-market electricity pricing. It provides risk managers with actionable confidence intervals, such as a "90% probability that the LCOH will remain below $4.00/kg."
Tornado Charts and Identifying Primary Cost Drivers (Power vs. CAPEX)
To effectively communicate the results of a multi-variable sensitivity analysis to non-technical stakeholders, TEA relies heavily on Tornado charts. A Tornado chart is a horizontal bar graph that visually ranks input variables according to their impact on the final output (LCOH). The variable that causes the widest swing in cost is placed at the top, creating a funnel or "tornado" shape. Consistently, across almost all green hydrogen models, electricity price occupies the paramount top position. Following electricity, capacity factor and installed CAPEX compete for the second-largest cost drivers. This visualization provides strategic clarity. If CAPEX reduction (the bottom of the tornado) only minimally impacts the LCOH compared to securing cheaper power, developers know to prioritize negotiating aggressive PPAs rather than over-engineering the plant to shave marginal equipment costs.
Regulatory Impacts, Subsidies, and Carbon Markets
Without regulatory intervention, green hydrogen currently struggles to achieve immediate cost-parity with heavily entrenched, fossil-based hydrogen. Technoeconomic analysis must therefore evolve beyond raw engineering costs to accurately incorporate the macroeconomic policy landscape. Governments worldwide are mobilizing to bridge the "green premium" gap through rigorous subsidy structures and carbon markets. In regions utilizing the European Union’s Emissions Trading System (ETS), the escalating price of carbon directly penalizes grey hydrogen producers, artificially lowering the benchmark price green hydrogen must beat. TEA models explicitly inject these regulatory mechanisms into cash flow projections, treating carbon credits as ancillary revenue streams. This reveals that the commercial success of early-stage green hydrogen plants is less a function of perfect thermodynamic optimization, and more heavily reliant on the strategic capturing of localized environmental policies.
Evaluating Production Tax Credits (e.g., US IRA) and Direct Grants
Up to $3.00 / kg H₂ Transforms TEA profitability instantly.
The passage of the US Inflation Reduction Act (IRA) fundamentally rewrote the rules of hydrogen technoeconomics. Under Section 45V, developers producing clean hydrogen with a lifecycle greenhouse gas emissions rate near zero can qualify for a Production Tax Credit (PTC) of up to $3.00 per kilogram (Source: energy.gov). In a TEA model, an operational subsidy of this magnitude acts as a massive counterbalance to CAPEX and OPEX, effectively subsidizing the bulk of the power costs. Consequently, an un-subsidized LCOH of $4.50/kg instantly drops to a highly competitive $1.50/kg net cost. Furthermore, direct capital grants (like those from the US Department of Energy’s Hydrogen Hubs program) slash the upfront equity requirements, fundamentally lowering the WACC. Evaluating these aggressive fiscal levers is now mandatory for generating realistic, investor-facing financial models.
Incorporating Carbon Pricing and Avoided Emissions into Economic Models
+ Carbon Credit Value
Beyond direct subsidies, progressive TEA incorporates "shadow carbon pricing" to assess long-term viability against tightening global emission regulations. Steam Methane Reforming (SMR) typically emits between 9 and 12 kilograms of CO2 for every kilogram of grey hydrogen produced. By quantifying these avoided emissions, analysts can monetize the environmental delta. If a carbon tax is projected to hit $100 per metric ton of CO2 by 2030, grey hydrogen experiences a direct cost penalty of roughly $1.00/kg. In the economic model, this penalty narrows the spread between grey and green alternatives, allowing green hydrogen to achieve cost-parity at a higher baseline LCOH. Incorporating projected, escalating carbon prices into the revenue stream of the cash flow analysis provides a crucial hedge, validating the project's profitability under future, stricter climate legislation.
Case Study: Technoeconomic Assessment of a 500 MW Wind-to-Hydrogen Facility
To crystallize the methodology of TEA, consider a 500 MW offshore wind-to-hydrogen facility. In this theoretical model, a dedicated wind farm feeds electrical power directly to an onshore PEM electrolyzer array, bypassing the wholesale grid to avoid transmission tariffs. The system boundary encompasses the wind turbines, subsea cables, water desalination skid, electrolyzer stacks, and a 350-bar buffer storage system. The primary objective of this case study is to determine if bypassing grid connections (which lowers OPEX electricity costs) can offset the lower utilization factor (the electrolyzer must ramp down when the wind stops blowing). This scale—half a gigawatt—enables massive CAPEX reduction through the six-tenths scaling rule, providing a textbook environment to run rigorous Monte Carlo simulations on wind intermittency and its direct influence on levelized costs.
Project Site Characteristics and Wind Resource Profiling
In an off-grid scenario, the thermodynamic viability of the 500 MW electrolyzer is inextricably bound to localized meteorological data. The TEA model relies on detailed wind resource profiling, utilizing historical data to construct a Weibull distribution of wind speeds over an average year. This translates directly into an expected capacity factor—typically 45% to 55% for premium offshore locations. The time-series data dictates the transient operation of the PEM electrolyzer, which must seamlessly throttle power input to match wind gusts. Moreover, site characteristics like bathymetry and proximity to industrial ports dictate the subsea cable transmission costs and the CAPEX of fresh water pipelines. Accurately modeling this highly specific, localized energy availability acts as the foundational variable OPEX input for the entire financial simulation.
System Integration, Economic Outputs, and Profitability Margins
Running the 500 MW case study through the financial engine yields decisive metrics. Without subsidies, the intermittent nature of the 45% wind capacity factor strands electrolyzer capital, returning a base LCOH of roughly $3.80/kg. While technically sound, this price point yields a negative NPV against current grey hydrogen benchmarks, making it un-bankable on pure free-market merits. However, upon integrating a $3.00/kg PTC via the Inflation Reduction Act, the net LCOH plummets to $0.80/kg. At a modeled off-taker sale price of $2.00/kg, the cash flow analysis flips dramatically. The NPV skyrockets, and the Internal Rate of Return (IRR) breaches 14.5%, easily satisfying the 10% WACC hurdle rate. The TEA confirms that while the engineering integration requires high CAPEX, the subsidy-leveraged profitability margins firmly justify the investment.
Conclusion
= Bankable Decarbonization
Technoeconomic Analysis represents the definitive tool for navigating the complexities of the emerging clean hydrogen economy. By systematically marrying thermodynamic constraints with financial realities, TEA prevents the misallocation of capital into inefficient, unscalable technologies. It demonstrates that green hydrogen feasibility is not monolithic; it varies wildly based on localized power purchase agreements, specific electrolyzer degradation profiles, and shifting policy environments. As demonstrated throughout the analytical framework, minimizing the levelized cost of hydrogen requires a holistic approach where scaling up capacity, securing rock-bottom renewable electricity, and leveraging government tax credits are pursued simultaneously. Ultimately, robust TEA provides the transparency, risk mitigation, and empirical justification that global infrastructure funds require to confidently execute the multi-billion-dollar investments needed to achieve net-zero energy targets.
Summary of Key Technoeconomic Drivers and Feasibility Hurdles
- Falling Renewables LCOE
- Gigawatt Economies of Scale
- Aggressive Subsidies (PTC)
- High WACC / Capital Cost
- Grid Interconnection Delays
- Electrolyzer Degradation
The primary driver pushing green hydrogen toward commercialization is the sustained decline in the Levelized Cost of Energy (LCOE) for wind and solar. Because power dictates up to 80% of operational expenses, ultra-cheap electrons effectively underwrite the entire thermodynamic process. Furthermore, scaling plant capacities from 10 MW to 500 MW unlocks aggressive CAPEX reductions via power-law scaling rules. However, significant feasibility hurdles remain. The high initial capital requirement (exacerbated by extensive Balance of Plant needs) creates extreme sensitivity to borrowing costs; a 2% increase in WACC can devastate project IRRs. Additionally, securing grid interconnection rights and navigating water scarcity introduces massive indirect "soft costs" and schedule delays. Navigating this tension between macro-level cost declines and micro-level execution risks remains the central challenge for project developers.
Future Cost Trajectories and Final Recommendations for Energy Investors
Looking forward, the global cost trajectory for green hydrogen is decidedly downward. As automated gigafactories for ALK and PEM electrolyzers come online, direct equipment costs are forecasted to drop by 40% to 60% by the early 2030s. Innovations in Solid Oxide (SOEC) technologies may soon shift the paradigm further by slashing electricity requirements via waste heat integration. For energy investors, the final recommendation is to avoid optimizing in a vacuum. A project with the most efficient electrolyzer may still fail if poorly positioned against off-taker logistics or restrictive energy tariffs. Success requires securing low-cost, firm renewable PPAs, locking in early-stage governmental tax credits, and maintaining highly flexible, dynamic technoeconomic models capable of pivoting alongside rapidly advancing electrochemistry and evolving carbon market regulations.