The Technoeconomic Analysis (TEA) Workflow
Technical Scope
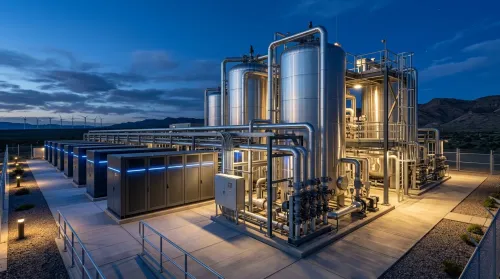
Define system boundaries, calculate mass/energy balances, and apply scaling factors to baseline architecture.
Economic Engine
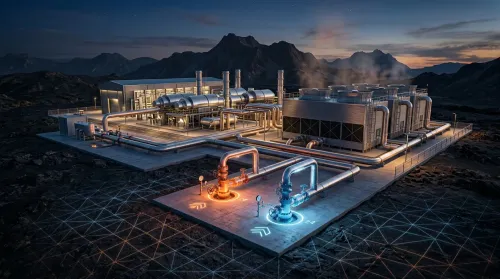
Quantify direct/indirect CapEx, lifecycle OpEx, degradation curves, and learning rate projections.
Financial & Risk
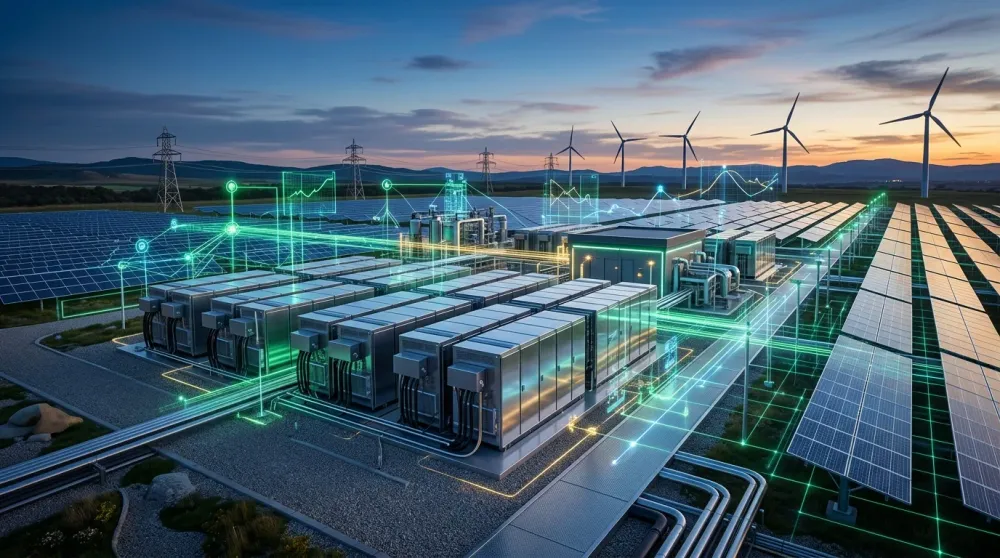
Execute DCF models to find LCOE, NPV, and IRR. Apply Monte Carlo simulations and policy valuations.
Comprehensive Technoeconomic Analysis (TEA) in the Energy Sector
Technoeconomic Analysis (TEA) bridges the gap between engineering feasibility and financial viability, serving as the foundational methodology for advancing commercial-scale energy infrastructure. In a sector characterized by high capital intensity and long asset lifespans, translating thermodynamic efficiencies into financial returns is not merely an academic exercise; it is an absolute commercial necessity. Every megawatt of generated power, every kilogram of green hydrogen produced, and every kilowatt-hour stored in a battery requires a rigorous accounting of the physical realities that dictate project economics. By unifying technical constraints with economic models, a comprehensive TEA constructs a holistic view of a project's lifecycle. It forces developers, engineers, and financiers to speak a common language, mapping the flow of electrons and molecules directly to cash flows and risk profiles. This analytical framework effectively strips away optimistic bias, relying instead on deterministic physics and hard market data to prove whether an innovative energy concept can survive the brutal realities of the open market.
Introduction to Technoeconomic Analysis for Modern Energy Systems
Modern energy systems are unprecedented in their complexity, transitioning from centralized, predictable fossil-fuel generation to decentralized, intermittent, and digitally integrated portfolios. Evaluating these systems requires an analytical approach that evolves beyond simple spreadsheet estimations. An introduction to TEA requires understanding that it is a dynamic, iterative process, continuously refining engineering assumptions as new market data emerges. It establishes a quantitative baseline for novel technologies that lack historical operational data, creating a synthetic track record through rigorous simulation. As energy grids incorporate diverse assets—from offshore wind to long-duration energy storage and advanced modular reactors—TEA provides the standardizing metric by which completely disparate technologies can be compared on an apples-to-apples basis. By simulating the technical performance of a facility minute-by-minute over a multi-decade horizon, TEA allows analysts to forecast long-term profitability, ensuring that modern energy architectures are both physically robust and economically resilient.
The Role of TEA in Navigating the Energy Transition
The global energy transition is fundamentally an exercise in risk management and capital allocation. Trillions of dollars must be deployed into technologies that, in many cases, have only recently graduated from bench-scale laboratories to pilot demonstrations. Here, TEA plays the critical role of a navigational compass, de-risking the leap across the commercialization "valley of death." It identifies the minimum technical performance thresholds required to achieve market parity with incumbent fossil fuels. For instance, when evaluating a novel solid-state battery or a direct air capture (DAC) facility, TEA pinpoints exactly which engineering variables—such as membrane permeability or cycle life—exert the greatest leverage over the final cost of the product. By highlighting these technical bottlenecks, TEA directs R&D budgets toward the most economically impactful improvements, ensuring that the transition is driven by pragmatic scalability rather than mere technological novelty.
Core Objectives and Value Proposition for Stakeholders
The value proposition of TEA varies significantly across the energy sector's stakeholder ecosystem, yet its core objective remains universal: to quantify and mitigate uncertainty. For venture capitalists and infrastructure funds, TEA provides the due diligence necessary to validate a startup's audacious cost projections, ensuring capital is not squandered on concepts that violate fundamental thermodynamic limits. For project developers, TEA is the ultimate optimization tool, allowing them to iterate through hundreds of design permutations to maximize return on invested capital (ROIC) before a single shovel breaks ground. For policymakers, robust technoeconomic models illuminate the exact quantum of subsidy required to make nascent technologies viable, guiding the efficient design of tax credits and grant programs. Ultimately, TEA translates technical minutiae into a compelling, defensible business case, aligning the disparate incentives of scientists, financiers, and regulators toward successful project execution.
Defining System Boundaries and Technical Scope
Before a single dollar can be modeled, the physical limits of the analysis must be rigidly defined. Establishing system boundaries is the architectural bedrock of any TEA, determining exactly which processes, material flows, and infrastructure requirements are included in the financial ledger. Ambiguity at this stage is fatal; failing to account for external utility connections, waste disposal routes, or necessary grid upgrades leads to catastrophic cost overruns during the construction phase. The scope dictates the resolution of the model, deciding whether the analysis will view the facility as a "black box" or intricately map the thermodynamics of every individual heat exchanger and compressor. This boundary definition ensures that the subsequent mass and energy balances are closed, providing a theoretically sound foundation upon which all capital and operational expenditures will eventually be built.
Establishing the Baseline Technology Architecture
Establishing the baseline technology architecture involves detailing the "Inside Battery Limits" (ISBL) and "Outside Battery Limits" (OSBL) of the proposed facility. ISBL encompasses the core proprietary conversion technologies—such as the electrolyzer stack in a hydrogen plant or the combustion turbine in a combined cycle facility. OSBL covers the crucial, yet often underestimated, supporting infrastructure: raw water treatment, power substations, access roads, and storage tanks. A meticulously defined architecture prevents scope creep and ensures that the design is grounded in commercially available, "off-the-shelf" components wherever possible. By freezing a baseline design, engineering teams can create detailed Process Flow Diagrams (PFDs) and Piping and Instrumentation Diagrams (P&IDs), which serve as the primary source of truth for downstream cost estimators.
Mass and Energy Balance Calculations
At the heart of the technical simulation are the mass and energy balance calculations, bound tightly by the First Law of Thermodynamics. Every molecule of feedstock entering the system boundaries must be accounted for as product, byproduct, or waste; every joule of energy must be tracked as useful work or rejected heat. Analysts frequently utilize chemical process simulators like Aspen Plus, ProMax, or specialized comprehensive energy analysis tools to model these flows under steady-state and dynamic conditions. These calculations determine the necessary sizing for all process equipment, dictating the cooling loads, parasitic electrical draws, and overall system efficiency. An accurate energy balance is the non-negotiable prerequisite for calculating a project's variable operational costs and ensuring the physical feasibility of the proposed design.
Scaling Factors and Capacity Design Constraints
Transitioning a technology from pilot scale to utility scale introduces complex non-linearities that must be handled via rigorous scaling factors. Engineers frequently rely on the "six-tenths rule," an empirical heuristic indicating that equipment costs scale non-linearly with capacity; doubling the size of a reaction vessel does not double its cost. However, scaling is ultimately bounded by physical and manufacturing constraints. A single wind turbine blade can only be built so long before material stresses cause catastrophic failure, and a chemical reactor can only be scaled up until thermal gradients become unmanageable. Understanding these constraints forces analysts to decide between building single, massive, custom-engineered trains (maximizing economies of scale) or utilizing modular, mass-produced smaller units (maximizing learning rates and reducing construction risk).
Capital Expenditure (CapEx) Modeling and Estimation
Once the technical architecture is locked and the equipment sized, the analysis pivots from physics to finance, beginning with the estimation of Capital Expenditures (CapEx). CapEx represents the total upfront investment required to bring the physical asset to commercial operation. In the energy sector, CapEx is typically the dominant driver of a project's total lifecycle cost, fundamentally dictating the requisite financing structure. CapEx modeling is categorized by accuracy tiers—ranging from Class 5 order-of-magnitude estimates used in early conceptual screening, to Class 1 definitive estimates based on hard vendor quotes. A robust CapEx model leaves no stone unturned, meticulously aggregating the costs of specialized hardware, bulk materials, skilled labor, and the complex web of engineering services required to execute mega-projects.
Direct Costs: Equipment, Materials, and Site Preparation
Direct costs represent the tangible, physical components of the project. This begins with the Major Equipment Cost (MEC)—the solar inverters, high-pressure compressors, or steam turbines specified by the mass and energy balances. To this, analysts must add the cost of bulk materials: the miles of copper cabling, specialized alloy piping, structural steel, and poured concrete. Crucially, direct costs also encompass the manual labor required for installation, equipment freight, and extensive site preparation activities. Civil works, such as grading uneven terrain for a solar array or driving deep foundation piles for an offshore wind turbine, are highly site-specific variables that can violently swing the economic viability of a project if modeled incorrectly.
Indirect Costs: Engineering, Procurement, and Construction (EPC)
Indirect costs act as the connective tissue that brings the direct components together into a functioning facility. These are the expenses incurred by the Engineering, Procurement, and Construction (EPC) contractor. They include the thousands of billable hours for detailed structural and electrical engineering, the procurement teams sourcing materials globally, and the on-site construction management overseeing safety and logistics. Furthermore, indirect costs account for the EPC contractor's profit margin and overhead, as well as crucial risk mitigation pools like project contingency. A well-constructed TEA must also account for Owner's Costs, which cover the developer's legal fees, environmental permitting, initial spare parts inventory, and the specialized insurance policies required during the construction phase.
Cost Function Development and Learning Curve Projections
Because the energy transition spans decades, static CapEx estimates are insufficient; analysts must project how costs will evolve over time using learning curves. Grounded in Wright’s Law, cost functions mathematically describe how the unit cost of a technology declines by a fixed percentage for every cumulative doubling of global deployed capacity. By applying these learning rates, TEA can forecast when currently expensive technologies, like floating offshore wind or green steel, will cross critical cost thresholds. High-authority datasets, such as the Annual Technology Baseline provided by the National Renewable Energy Laboratory, are instrumental in developing these projections (Source: nrel.gov). By modeling future CapEx reductions, developers can strategically time their market entry to maximize long-term profitability.
Operational Expenditure (OpEx) and Lifecycle Dynamics
While CapEx dictates the initial barrier to entry, Operational Expenditure (OpEx) governs the day-to-day survival of the energy asset over its multi-decade lifecycle. OpEx encompasses all cash outflows required to operate, maintain, and administer the facility, directly impacting the project's ongoing cash flow profile. In technoeconomic modeling, failing to accurately capture the lifecycle dynamics of an asset inevitably leads to stranded assets and distressed debt. A sophisticated TEA treats OpEx not as a flat annual fee, but as a dynamic, escalating curve that responds to component wear-and-tear, macro-economic inflation, and variable operational profiles. Balancing high upfront CapEx against lower long-term OpEx is the core optimization puzzle faced by energy engineers.
Variable Costs: Feedstocks, Energy Inputs, and Consumables
Variable costs fluctuate in direct proportion to the facility's production volume or capacity factor. For a bioenergy plant, this involves the complex supply chain logistics and spot-market pricing of agricultural feedstock. For an electrolytic hydrogen facility, the largest variable cost is the parasitic electrical load drawn from the grid, exposing the project to wholesale power price volatility. Variable costs also include crucial chemical consumables, such as water treatment chemicals, solvents for carbon capture systems, and the periodic replacement of specialized catalytic materials. Accurately modeling these costs requires linking the TEA to granular market price forecasts, ensuring the project remains cash-flow positive even during commodity price spikes.
Fixed Costs: O&M, Insurance, and Labor
Fixed costs are incurred regardless of whether the energy asset is running at full capacity or sitting idle. These include routine Operations and Maintenance (O&M) contracts, land lease payments, property taxes, and comprehensive insurance premiums that protect against operational liabilities and natural disasters. A significant portion of fixed OpEx is dedicated to human capital: the specialized plant operators, shift supervisors, and administrative staff required to run the facility safely. In highly automated renewable assets like solar PV, fixed O&M might be relatively low, but for complex thermochemical plants, the fixed labor and maintenance burden is substantial and must be inflated annually in the financial model to account for wage growth.
Component Degradation and Replacement Scheduling
Physical assets operate in harsh environments and inevitably succumb to thermodynamic wear, requiring the TEA to model strict component degradation curves. Solar photovoltaic panels experience light-induced degradation, losing roughly 0.5% of their efficiency annually. Lithium-ion battery energy storage systems (BESS) suffer from capacity fade driven by charge-discharge cycling and thermal stress. To maintain the project's nameplate capacity and fulfill off-taker agreements, the financial model must schedule and capitalize major equipment replacements—known as augmentation or major overhauls. Forecasting exactly when an electrolyzer stack must be replaced or a gas turbine must undergo a hot-gas-path inspection ensures that sufficient cash reserves are trapped within the project vehicle to fund these massive, lifecycle-critical expenditures.
Financial Modeling and Profitability Metrics
With the physical engineering translated into localized cost data, the TEA transitions into the realm of structured corporate finance. The financial model acts as the ultimate crucible for the project, synthesizing CapEx, OpEx, and performance data into standardized profitability metrics that investors rely upon to deploy capital. This phase is heavily governed by the time value of money, tax accounting rules, and the specific cost of capital available to the developer. It transforms a static engineering schematic into a dynamic, multi-period cash flow waterfall. Without a rigorously constructed financial model, even the most elegantly engineered energy technology is completely invisible to the institutional capital required to build it.
Calculating Levelized Cost of Energy (LCOE) and Equivalent Metrics
The Levelized Cost of Energy (LCOE) is the fundamental benchmark metric in the power sector, representing the minimum constant price at which electricity must be sold to break even over the project's lifetime. It is calculated by dividing the net present value of all CapEx and OpEx by the net present value of all electricity generated. As energy systems diversify, this metric has spawned equivalents: Levelized Cost of Hydrogen (LCOH), Levelized Cost of Storage (LCOS), and Levelized Cost of Carbon (LCOC). While powerful for high-level comparisons, a robust TEA acknowledges the limitations of levelized metrics, recognizing that they often fail to capture the true time-of-day market value of energy in highly penetrated renewable grids.
Discounted Cash Flow (DCF) Analysis: NPV and IRR
To evaluate true profitability, analysts rely on Discounted Cash Flow (DCF) models to calculate Net Present Value (NPV) and Internal Rate of Return (IRR). By mapping out every dollar flowing in and out of the project vehicle on a monthly or quarterly basis over 20 to 30 years, the DCF model captures the exact timing of tax liabilities, debt service, and equity distributions. A positive NPV indicates that the project creates wealth beyond the investor's minimum required return, while the IRR provides the annualized effective compounded return rate. These metrics allow developers to rank competing energy projects within a portfolio, ensuring limited capital is channeled toward assets with the most robust risk-adjusted returns.
Capital Structuring: Debt-to-Equity Ratios and WACC
Utility-scale energy projects are rarely funded entirely by cash; they utilize complex project finance structures. The TEA must model the specific Capital Stack, determining the optimal Debt-to-Equity ratio. Debt is typically cheaper but requires rigid, mandatory repayment schedules that can bankrupt a project during operational hiccups. Equity is more flexible but demands a significantly higher rate of return to compensate for taking on the ultimate project risk. Blending these costs yields the Weighted Average Cost of Capital (WACC), which serves as the discount rate in the DCF analysis. By optimizing the capital structure—perhaps by securing low-interest green bonds or government loan guarantees—developers can drastically improve the project's bottom-line profitability.
Sensitivity Analysis and Risk Quantification
A deterministic base-case financial model represents only a single, often highly optimistic, version of the future. The real energy landscape is fiercely volatile, besieged by macroeconomic shocks, severe weather events, and supply chain disruptions. Therefore, a professional TEA aggressively pressure-tests the base-case assumptions through rigorous sensitivity analysis and stochastic risk quantification. This process breaks the model down to identify the exact thresholds at which the project becomes unprofitable. By quantifying these risks mathematically, developers can negotiate better EPC guarantees, secure appropriate hedges, and prove to lenders that the project can survive under severe duress, thereby securing more favorable financing terms.
Single-Variable Sensitivity and Tornado Charts
The first line of defense in risk quantification is single-variable sensitivity analysis, where key assumptions—such as capital costs, discount rates, or capacity factors—are independently adjusted up and down by a set percentage (e.g., +/- 20%). The resulting impact on the project's NPV or IRR is plotted on a Tornado Chart, so named because the variables with the widest impact form the broad top of the chart, tapering down to the least impactful variables at the bottom. This visual tool immediately highlights the project's most sensitive parameters. If a 10% increase in natural gas prices utterly destroys the project's IRR, management knows instantly where to focus their hedging strategies and contract negotiations.
Monte Carlo Simulations for Stochastic Risk Assessment
While single-variable sensitivity is useful, real-world risks are highly correlated and occur simultaneously. To model this, advanced TEA employs Monte Carlo simulations, running the financial model thousands of times. Instead of static inputs, variables are assigned probability distributions (e.g., a bell curve for wind speeds, or a log-normal distribution for steel prices). The output is a stochastic probability curve of the project's IRR. This allows analysts to transition from saying "The expected IRR is 12%" to "There is a 90% probability (P90) that the IRR will exceed 8%, and only a 5% chance of capital loss." This rigorous statistical approach is standard practice for securing non-recourse project finance debt.
Navigating Supply Chain Volatility and Commodity Pricing
The energy transition is intrinsically tied to raw material extraction and global supply chains. A modern TEA must account for extreme volatility in critical minerals like lithium, copper, polysilicon, and iridium. Supply chain bottlenecks, tariffs, and geopolitical conflicts can cause CapEx assumptions to double overnight. To navigate this, technoeconomic models incorporate commodity price forecasting and evaluate the cost of forward-hedging contracts. Additionally, the TEA assesses the risk of delayed construction timelines caused by shipping constraints, quantifying how capitalized interest during construction (IDC) inflates if an essential transformer is delayed at port for six months.
Policy, Regulatory, and Environmental Valuation
Energy markets are not pure free-market environments; they are highly regulated and heavily subsidized arenas designed to achieve broader socio-economic and climate goals. A project's technical excellence is irrelevant if it fundamentally conflicts with local regulatory frameworks or fails to capture available incentives. A comprehensive TEA explicitly models the complex layer of policy directives, carbon pricing mechanisms, and grid interconnection rules. By translating environmental externalities and legislative mandates into hard dollar figures within the cash flow model, analysts ensure that the project is optimally positioned to capitalize on government support while remaining shielded from emerging regulatory penalties.
Impact of Subsidies, Tax Credits, and Grant Programs
Government interventions frequently make or break the economics of early-stage energy technologies. The TEA must meticulously model the influx of capital from policies like the U.S. Inflation Reduction Act (IRA), which provides massive Investment Tax Credits (ITC) and Production Tax Credits (PTC). Modeling these requires complex tax equity partnership structures within the financial model to efficiently monetize the credits. Furthermore, analysts must assess eligibility for low-cost debt from entities like the Department of Energy's Loan Programs Office (Source: energy.gov). Accurately integrating these subsidies reduces the effective WACC and drastically accelerates the point at which novel green technologies achieve market parity with incumbent systems.
Carbon Pricing and Environmental Externality Valuation
As global regulatory regimes tighten, valuing environmental externalities is no longer optional. Technoeconomic models must internalize the cost of greenhouse gas emissions by applying carbon pricing schemes, such as the European Union Emissions Trading System (EU ETS) or regional cap-and-trade programs. Even in jurisdictions without a formal carbon tax, institutional investors increasingly require the use of a "Social Cost of Carbon" shadow price to future-proof their portfolios against impending climate legislation. By financially penalizing emissions within the model, TEA properly values the premium associated with deploying carbon capture and storage (CCS) technologies or transitioning to zero-emission operational profiles.
Grid Interconnection Policies and Market Design Impact
A power generation asset has zero value if it cannot deliver its electrons to the end user. Grid interconnection policies severely impact both project timelines and ultimate CapEx. The TEA must account for the staggering delays currently seen in regional transmission organization (RTO) interconnection queues, as well as the multi-million-dollar network upgrade costs suddenly forced upon developers. Furthermore, the analysis must evaluate local market design—such as locational marginal pricing (LMP), nodal congestion, and the risk of renewable curtailment during periods of over-generation. Research into historical grid behaviors ensures the modeled capacity factor reflects physical grid constraints, not just optimal weather conditions (Source: lbnl.gov).
Case Study: Technoeconomic Assessment of a Utility-Scale Energy Project
To synthesize the myriad complexities of TEA, examining a real-world application provides critical context. A utility-scale energy project serves as the perfect crucible, testing the intersection of thermodynamic limitations, supply chain realities, and structured finance. This case study strips away theoretical abstractions, applying the rigorous methodology of boundaries, cost estimation, and risk quantification to a tangible asset. By walking through the project overview, the baseline financial outputs, and the subsequent scenario analyses, stakeholders can witness firsthand how a technoeconomic model operates not merely as a spreadsheet, but as a dynamic decision-making engine that dictates the ultimate success or failure of a multi-million dollar infrastructure investment.
Project Overview, Market Context, and Technical Assumptions
Consider a proposed 150 MW Solar PV facility co-located with a 50 MW / 200 MWh Lithium-Ion Battery Energy Storage System (BESS) in the ERCOT market (Texas). The ISBL includes high-efficiency bifacial modules and a DC-coupled BESS to capture clipped solar energy. The OSBL encompasses a newly constructed 34.5 kV to 138 kV step-up substation. The technical mass/energy balance models a 28% solar capacity factor, accounting for regional irradiance, historical weather patterns, and an annualized 0.5% PV degradation rate. The market context is characterized by extreme summertime price volatility and high curtailment risk, necessitating the BESS to time-shift generation away from solar-peak hours into the highly lucrative evening net-load peak.
Financial Breakdown and Base-Case Economic Results
The direct CapEx for this hybrid facility is estimated at $1,100/kW for the solar and $350/kWh for the BESS, yielding a total CapEx of approximately $235 million after accounting for EPC margins and interconnection network upgrades. Operating with a 30% Investment Tax Credit (ITC) monetized via a tax equity partner, the financial model utilizes a 65:35 Debt-to-Equity ratio at a 7.5% WACC. The base-case DCF analysis yields a blended Levelized Cost of Energy (LCOE) of $42/MWh. Against a conservative forward price curve for energy and ancillary services, the project demonstrates a robust Net Present Value (NPV) of $18 million and an unlevered Internal Rate of Return (IRR) of 9.2%, signaling a fundamentally viable project.
Scenario Analysis: Evaluating Market Shifts and Policy Changes
The robustness of the 9.2% IRR is immediately tested through scenario analysis. Scenario A evaluates a 25% surge in battery pack costs due to critical mineral shortages; the IRR drops to 7.8%, remaining viable but compressing developer margins. Scenario B models a shift in policy, assuming the ITC drops from 30% to 10%; the NPV immediately plunges into negative territory, highlighting the project's heavy reliance on government incentives. Finally, a Monte Carlo simulation evaluates extreme weather events and nodal congestion, revealing a P90 IRR of 6.1%. Armed with these scenarios, the developer opts to lock in long-term BESS supply contracts and secure an aggressive Power Purchase Agreement (PPA) floor price to mitigate downside risk.
Conclusion
The disciplined execution of a Technoeconomic Analysis is the ultimate safeguard against the systemic destruction of capital in the energy sector. As the global economy aggressively pivots toward decarbonization, the margin for error in deploying novel infrastructure is vanishingly small. TEA provides the unyielding quantitative rigor required to separate transformative energy solutions from thermodynamic pipe dreams. By enforcing a continuous feedback loop between engineering constraints, market economics, and regulatory landscapes, TEA ensures that innovation is tethered to commercial reality. Ultimately, those who master this analytical framework will not only survive the complexities of the energy transition, but will successfully architect and finance the resilient, profitable energy grids of the future.
Strategic Takeaways for Energy Investors and Developers
For energy investors and developers, the primary takeaway is that TEA is not a monolithic, one-time checkbox required for final investment decision (FID); it is a living, breathing digital asset. Developers must continuously update their models as vendor quotes solidify and market curves shift. Investors must leverage TEA to look beyond simple levelized metrics, focusing instead on stochastic risk profiles and the specific technical bottlenecks that threaten long-term cash flows. Capital deployment should strictly favor projects where the TEA proves resilience across multiple adverse scenarios, rather than those relying on perfectly aligned "base-case" assumptions. Rigorous technoeconomic scrutiny is the most effective tool for maximizing risk-adjusted returns in an inherently volatile sector.
Next Steps for Implementing Robust TEA Frameworks
To implement robust TEA frameworks, energy firms must aggressively break down the traditional silos isolating their engineering, finance, and policy departments. The immediate next step is the adoption of integrated modeling platforms that link thermodynamic simulation software directly with dynamic financial spreadsheets. Furthermore, the industry is rapidly moving toward the digitization of TEA, utilizing digital twins and machine learning to feed real-time SCADA data back into conceptual models, validating pre-construction assumptions against actual operational performance. By standardizing their TEA methodologies, investing in high-fidelity market data feeds, and fostering cross-disciplinary analytical teams, organizations can deploy capital with supreme confidence and lead the commercialization of next-generation energy infrastructure.