
CogenS™ Pathfinder
NewDistrict Energy OptimizerDistrict heating and cooling technoeconomic modeling software
Find the district heating and cooling plant with the strongest investment case for a whole campus. Each technology is tried on its own and together, sized to the combined load, and explained in a full TEA report. Available now.
Why CogenS™ Pathfinder
A District Plant Is More Than the Sum of Its Buildings.
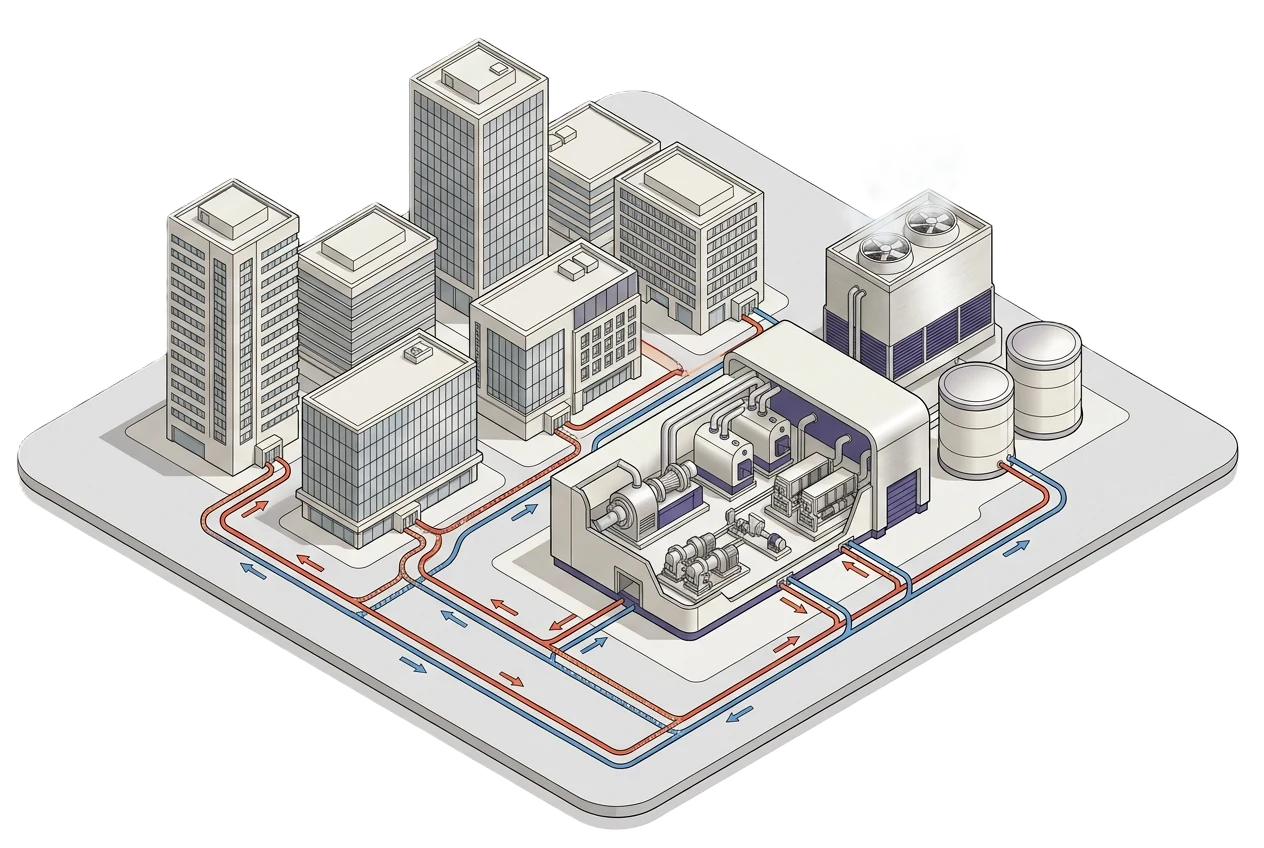
A district plant makes heat, cooling and hot water in one place and sends it to many buildings through buried pipes. The buildings peak at different hours, the pipes lose heat all year, and the technologies depend on each other. Size each building on its own and add them up, and you buy equipment that never runs.
CogenS™ adds the hourly building loads into one campus load, counts the pipe losses as the steady load they are, and compares complete plants over their whole life. The result is central plant optimization you can explain to a board, a client or a lender.
Capabilities
Built for District Plant Design
District heating software and district cooling software in one run, from the buildings to the verdict.
Your Whole Campus
Add each building group with its own type, size and count. Pick the loads the plant serves: heating, cooling and hot water by default, with electricity as an option. Enter each group's pipe route and heat loss if you have them.
Every Technology, Alone and Together
Boilers, heat pumps, chillers, cogeneration (CHP), gensets, water heaters and solar are each run on their own first. Then one optimization looks at the whole mix at once, including batteries and thermal storage.
Sized to the Combined Load
Every option is sized to the campus load the buildings make together, hour by hour, not the sum of their separate peaks. You never type a plant size, so the plant is not oversized.
The Strongest Investment Case
Complete plants are compared. The most expensive working plant is the base case, and the recommended plant is the one with the best net present value (NPV) against it. Total cost of ownership breaks a tie.
Rate Cards and Deals
Set heating and cooling rates for each customer class, start from a common district deal shape, or model the plant under an Energy-as-a-Service (EaaS) contract to see what it earns.
Full TEA Report
A technoeconomic analysis (TEA) report with the verdict, a decision tree that explains it, the system diagram, dispatch charts, energy flows and a full data export, ready to share.
How It Works
The District Energy Optimizer Workflow
A guided page flow from the buildings on your campus to the recommended plant
Site Information
Buildings, loads & pipes
Utility Rates
Electricity & gas tariff
Technology Mix
Candidates for each load
Financial Parameters
Rates, costs & deals
Model Execution
Both passes, one press
Report
Verdict & comparison
One press runs both passes and prices the comparison plants. Progress shows each step by name, and you can leave the page while it runs.
Signature Features
Everything You Need for District Energy Feasibility
Hourly Campus Load
An hourly profile for every building group for all 8,760 hours of the year, from the building-type database for your location or from your own upload, added into one combined load with the diversity factor reported.
Network Heat Losses
Pipe route length and heat loss per metre for each building group. The loss is added as a steady load all year, shared between the thermal loads, so summer operation is not underestimated.
Two-Pass Optimization
First each technology runs alone through the same full simulation a standalone CogenS project uses. Then one optimization chooses sizes and hourly dispatch for the whole mix, and each machine's own model runs on that plan.
Automatic Sizing
The run sizes every machine to the campus load it serves, plus a sizing margin you control, and fills in performance from the closest catalog model, with part-load curves, pumps and auxiliaries.
Sensitivity Analysis
See which input moves the result most, so you know which assumptions deserve a second look before the decision is made.
District Report
The verdict, a decision tree, the recommended system with its diagram and dispatch charts, energy flows, every complete plant compared side by side, and a full hourly data export.
What You Get
A Verdict You Can Defend
The district report names the winning plant, shows what each unit of heat, cooling and power costs, and prices how the plant gets paid.
The Winning Plant
Every complete plant is compared, and any plant that leaves a load unserved is ruled out. The most expensive working plant is the base case. The winner is shown as an investment against it, with NPV, internal rate of return (IRR), payback and benefit-cost ratio, all before tax.
Cost per Unit of Heat, Cooling and Power
Each plant shows its levelized cost per kWh delivered to the buildings, and each option on the decision tree shows its cost per kWh of the load it serves. Energy use, CO₂ and total cost of ownership sit beside it.
Rate Cards and Deals
Bill each customer class with connection, capacity, energy and fixed charges, and see the yearly revenue and effective rate per class. Or test a provider-owned plant under a power purchase agreement (PPA), concession, capacity tolling or shared savings deal, with the charge solved for the provider's target return.
Built For You
Designed for District Energy Professionals
For anyone choosing, planning or selling a central plant that serves many buildings.

Central Plant & District Energy Engineers
Compare complete plant options for a campus on the same combined load, with network losses, part-load curves and hourly dispatch, before committing to a layout.

Energy Consultants & Master Planners
Deliver district energy feasibility studies that test every technology alone and together, with a decision tree that shows the client why one plant won.

Campus & University Facility Leaders
Plan a plant replacement or a new central plant for many buildings, and see the investment case, the cost per unit of heat and cooling, and the CO₂ of each option.

District Energy Utilities, Developers & EaaS Providers
Price heating and cooling for each customer class, test common district deal shapes, and solve an Energy-as-a-Service charge for your target return.
Why It Matters
Solving the Hardest Parts of District Plant Design
Buildings Peak at Different Hours
An office, a dorm and a lab do not peak together, so the campus peak is smaller than the sum of the building peaks. CogenS adds the hourly profiles first and sizes to the peak of the combined curve, so the diversity comes from your buildings, not a rule of thumb.
Pipes Lose Heat All Year
A percentage on top of demand puts too much loss on the winter peak and almost none in summer. CogenS treats the pipe loss as the steady load it is, which is what keeps a boiler or a cogeneration unit running on a mild summer night.
Technologies Depend on Each Other
A CHP unit is sized for electricity and gives off heat, and an absorption chiller needs a heat source. CogenS never compares one machine against another on its own. It compares complete plants that each serve every load.
Portfolio Optimizer
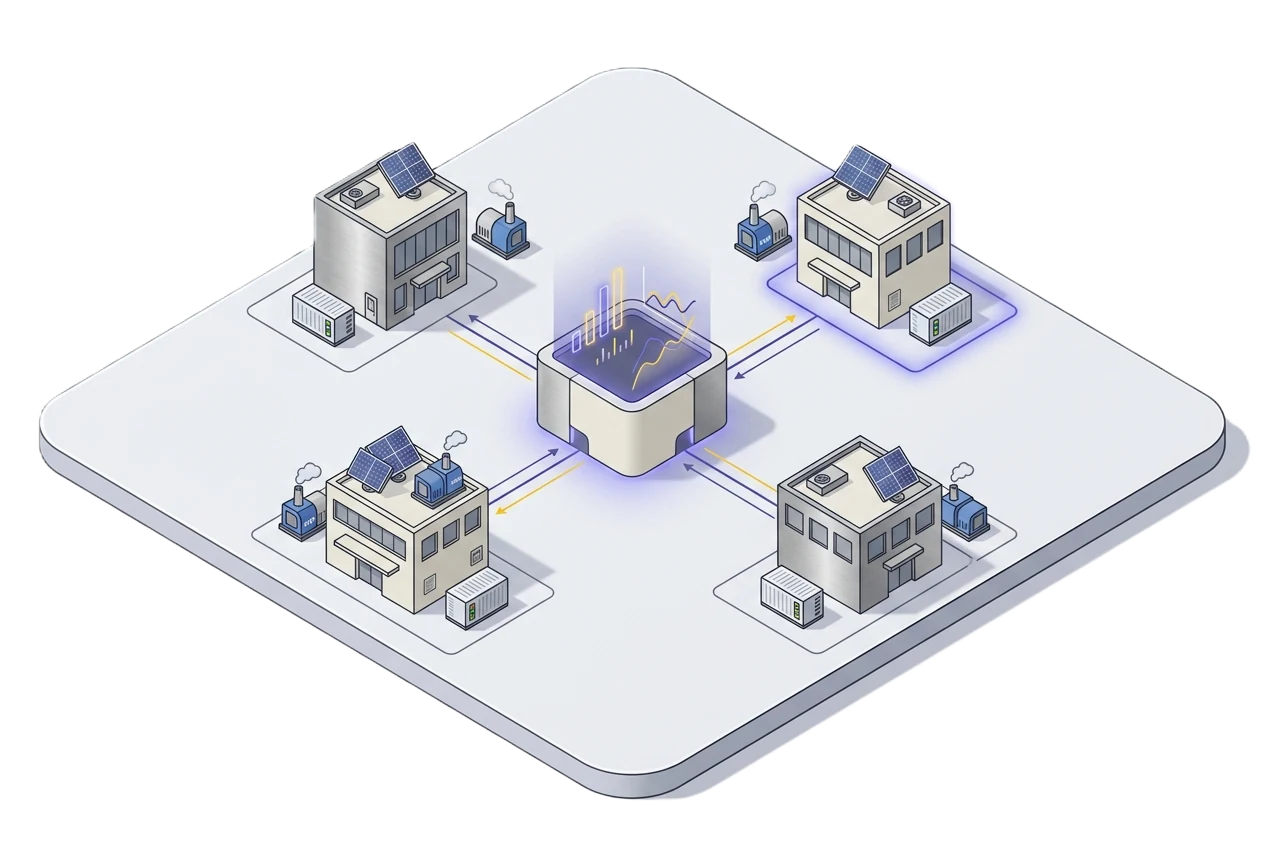
Study up to 5 sites in one run, each with its own location, loads and rates, and find the best technology mix for each. Built for energy-as-a-service providers and EPCs with many locations. It will be $480/user/mo.
Start Your District Project
Start free and use your free model runs on a district project, or subscribe to the District Energy Optimizer from $320/user/mo ($3,200/user/yr). Teams of 2 pay $288 per user, and 3 or more pay $256 per user.